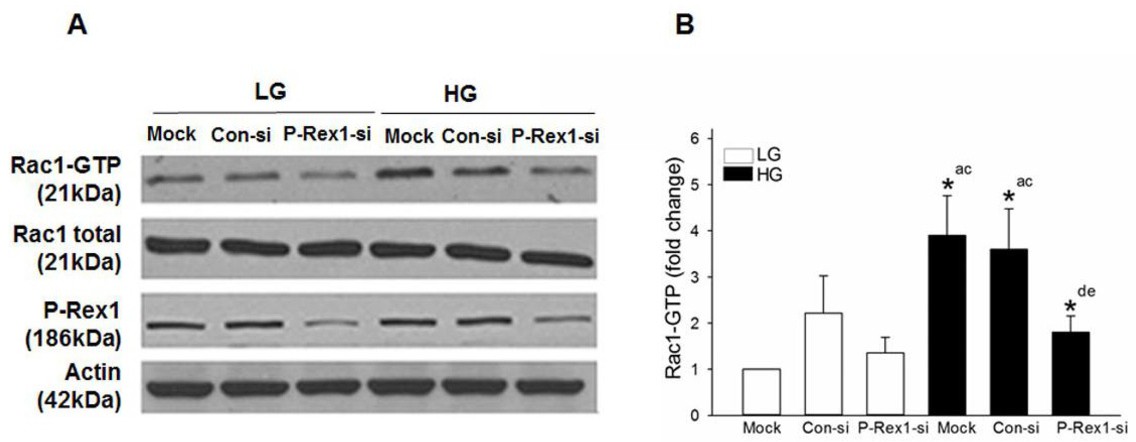
Fig. 2. Knockdown of P‐Rex1 expression inhibits glucose‐stimulated Rac1 activation in INS‐1 832/13 cells. Panel A: INS‐1 832/13 cells were transfected with Con-si or P-Rex1-si as described in the Methods section. After 48 hours of transfection, cells were subjected to overnight starvation and then were treated with LG (2.5 mM) or HG (20 mM) for 15 mins. Rac1 activation was quantified by Rac1 pull down assay. Expression of total Rac1, P-Rex1 and actin in respective cell lysates is also provided. Representative blots from three independent studies are provided. Panel B: Densitometric quantitation of activated Rac1 in Panel A is shown here. The results from three independent experiments are presented as means ± SD. The data are expressed as fold change relative to LG‐mock. (* p< 0.05) Comparisons shown: a ‐ significant compared with LG‐treated mock; b ‐ significant compared with LG treated Con‐si; c ‐ significant compared with LG treated P‐Rex1‐si; d ‐ significant compared with HG treated mock.